Heap Walker View Layout


  All heap walker views share the same basic layout:

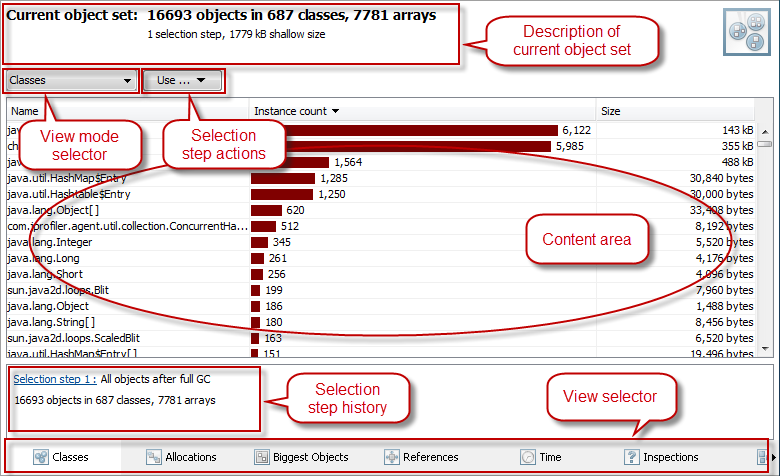
  The description of the current object set shows
  • what kind of objects are in the current object set. If there is more than one class or array type in the current object set, a cumulative count will be given separately for class instances and arrays. As it is often the case, if all objects are of a single class or array type, the class name or array type will be displayed.
  • how many selection steps have occurred so far. This gives an idea of the complexity of the current selection.
  • how much space the current object set uses on the heap. Note that this is the shallow size which does not include the sizes of referenced arrays and class instances.
  Most screens in the heap walker have more than one view mode. The drop-down list in the top-left corner give access to different related views. For example, the reference view has 4 different view mode, for outgoing and incoming references as well as for cumulated outgoing and cumulated incoming references.
  With the selection button you can add another selection step. A new object set that contains only the currently selected objects will be created. Some views offer more than one way to add a selection step in a drop-down menu.
  The main portion of the screen displays the specific content of the current view.
  The selection history shows all selection steps that have occurred so far. The selection history pane is a vertical split pane and can be resized to the most convenient size. You can toggle the visibility of the selection history window by
  • choosing View->Show Selection Steps from JProfiler's main menu
  • clicking on the corresponding toolbar button
  The view selector allows you to switch between the six different views without changing the current object set. The views show
  • the classes in the current object set
  • the allocation spots of the current object set
  • the biggest objects in the current object set
  • the references of the current object set
  • a graph of allocation times of the current object set
  • a list of inspections that can be performed on the current object set
  • the graph where objects from different object sets can be added. This view is different from the others in that is does not only show data from the current object set.